- Strategic Plan
- Information Literacy & Technology
How Data is Helping Inform Strategic Plan Goals
Overlake’s multi-year strategic plan, Coming Together, focuses on four main pillars of work; well-being, attract & retain, diversity, equity & inclusion, and institutional identity. In each of these pillars are goals to identify when progress is made. To help measure that progress will be new data dashboards, going live next week.
“We are embarking on ambitious initiatives to define how data is used at Overlake, or put another way, establishing our aspirational ‘data culture,’” explains Jay Heath, director of technology. “In this work, we are seeking the right balance of data literacy, accessibility, transparency, and privacy to answer the questions, ‘Are we making progress in our goals? How do we know?’”
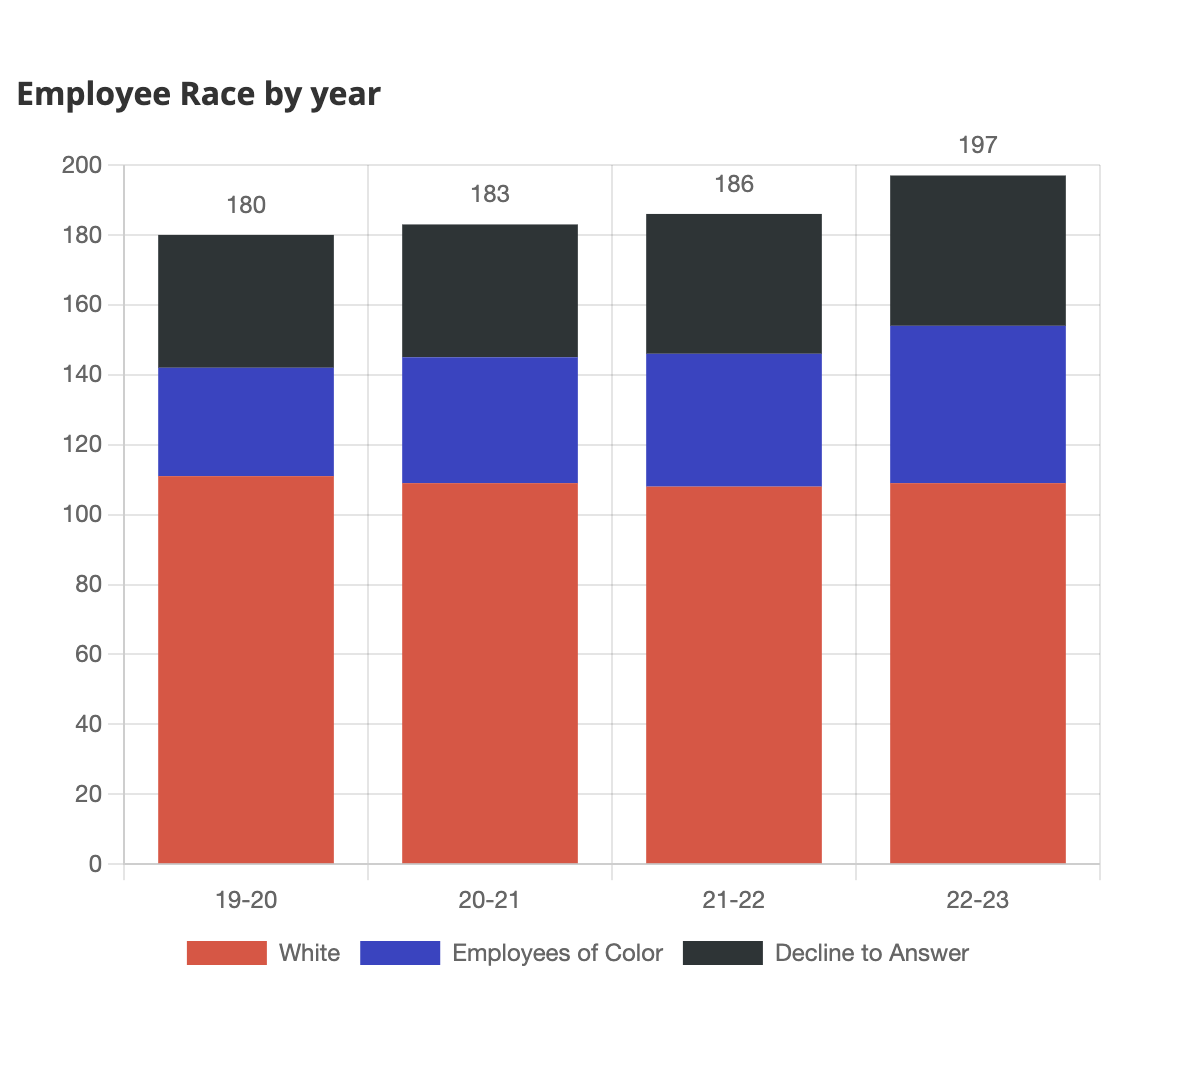
Beginning last year, Heath and the Information Literacy & Technology team, along with administrative leads of each strategic plan pillar, have been meeting to determine how to create dashboards that reflect the data needed to determine if goals are being met. The first three dashboards, built using open-source tools by David Basham, Overlake's data lead and computer science teacher, will be used by our community. They measure areas of Hiring and Retention, Employee Demographics, and Student Demographics.
“The dashboard tells us a story of where we are and to help us design the story of where we wish to go to be a more equitable and inclusive institution,” explains Mahtab Mahmoodzadeh, director of diversity & inclusion. Mahmoodzadeh has partnered with Heath to strategically look at the school’s efforts in meeting goals in the diversity, equity & inclusion pillar, as well as DEI goals in the attract & retain pillar. “This work has given me the rich opportunity to collaborate with Jay to determine ways to measure what we value for our equity and inclusion goals. This is just the beginning. As we develop our data literacy and begin to design strategic measures to track our progress, it can potentially allow us to make shifts as we reflect on the impact of our practices. Our collaboration is essential to bring the lens of the work of DEI and to tell the story with technology as the tool.”
“Data is derived primarily from our School Information System, Veracross, and includes data from other sources, including surveys conducted with our community, such as the employee engagement survey conducted in 2018, 2022, and again in February 2023, as well as the High Achieving Student Survey (HASS) conducted last spring and planned again for April 2023,” explains Heath.
“Data can drive decision making in a powerful and informative way for the good of an organization,” says Head of School Matt Horvat.
Later this month summary data from the 2022 family engagement survey will be available to our community. “The information from this survey will help us measure progress in areas of each pillar, which is crucial to the overall success of the strategic plan,” explains Horvat. The family engagement survey will run bi-annually, while the employee and student surveys will run each year. Keep in mind that the dashboards are based on self-reported data. Families can update fields, such as race and ethnicity in their Household Profile Update, located in their parent portal here: portals.veracross.com/overlake/parent
The third focus of Overlake’s ongoing data culture work is in the area of data literacy. Heath and others in the community are focused on educating those in our community on how to understand the data collected. For example, in August, results of the employee engagement summary were shared with employees. In addition, departmental summaries were provided to school leaders to help with understanding and opportunities to engage with departments to improve outcomes across the school. Next month, faculty and staff will begin analyzing and collaborating around how to move forward with the results from the student survey. “The HASS data is incredibly rich and gives us an insight into our most important constituent - our students,” says Heath. “We will then run the survey again this April to understand where trends are emerging to best support our students. This is the process of building the muscle to measure what we value systemically, reporting on our findings and progress along the way.”
Editor's note: Overlake's dashboards are being built on an open source platform to allow other schools regionally and nationally to obtain similar dashboards to track their goals.